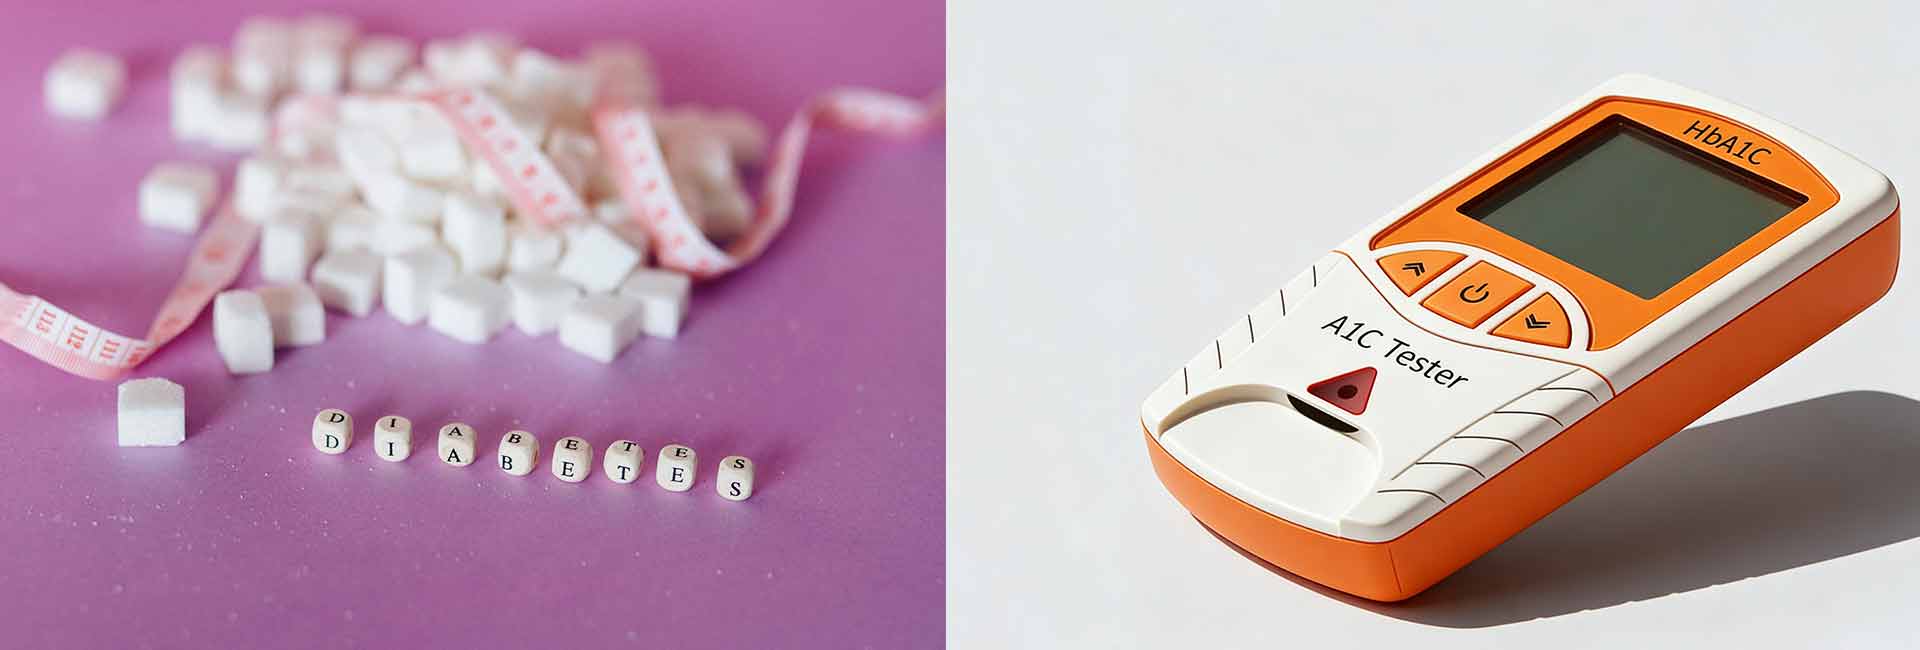
Choosing the best method for diabetes management depends on individual needs. Many people rely on the A1C blood test, but continuous glucose monitoring (CGM) with estimated eAG and GMI often provides a more accurate picture of blood sugar levels. Clinical studies show that CGM eAG reflects true average glucose, while A1C test results can be influenced by pregnancy, ethnic background, kidney disease, and other factors.
| Test Type | Accuracy | Influencing Factors | Clinical Outcome |
|---|---|---|---|
| A1C Test | Often inaccurate | Pregnancy, ethnic background, kidney disease, liver disease, blood dyscrasias | Can be off by 0.7-1% |
| CGM eAG | More accurate | N/A | True representation of average blood sugar over time |
Diabetes affects 537 million people worldwide, with numbers expected to reach 783 million by 2045. The Middle East and North Africa region has the highest prevalence at 16.2%. Each person must understand how these tools fit their unique circumstances and discuss options with their healthcare team.
Key Takeaways
- Understand the differences between A1C and CGM eAG. A1C shows average blood sugar over months, while CGM provides real-time glucose trends.
- Consider your personal health and lifestyle when choosing a monitoring method. CGM may suit those with frequent blood sugar changes, while A1C is simpler for others.
- Use both A1C and CGM data for a complete view of diabetes management. This combination helps identify hidden glucose swings and adjust treatments effectively.
- Regularly monitor your A1C and CGM data. Check A1C at least twice a year and review CGM data frequently to make timely treatment adjustments.
- Collaborate with your healthcare team. Open communication ensures personalized care and helps interpret results for better diabetes management.
Understanding A1C Blood Test and eAG
What the A1C Blood Test Measures?
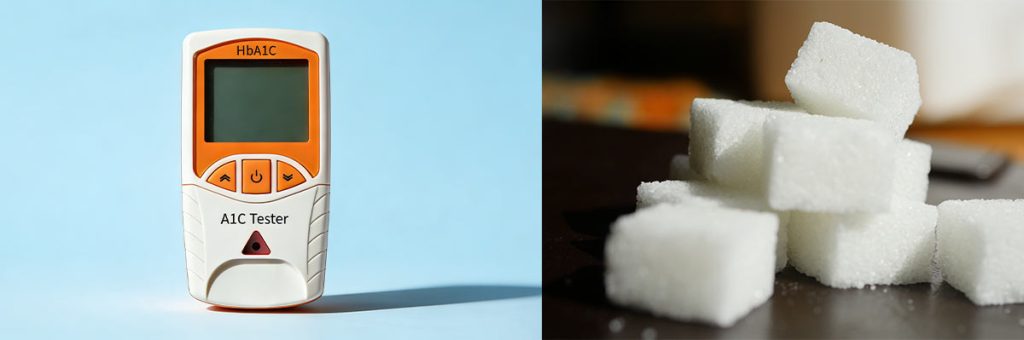
The A1C test serves as a cornerstone in diabetes management. An A1C tester measures the percentage of hemoglobin coated with glucose in the blood. This percentage reflects average blood glucose levels over the past two to three months. The A1C blood test helps diagnose diabetes and monitors how well treatment works. Many healthcare providers rely on the A1C test because it offers a long-term view of blood sugar control.
- The A1C test evaluates average blood glucose levels over two to three months.
- It measures the percentage of hemoglobin coated with glucose.
- The test assists in diagnosing diabetes and monitoring treatment effectiveness.
How eAG Is Calculated from A1C?
Estimated average glucose, or eAG, translates A1C results into a value that resembles daily glucose readings. This calculation uses a mathematical formula, making it easier for patients to understand their results. For example, an A1C of 7.0% corresponds to an eAG of about 154 mg/dL. The formula below shows how to convert A1C to eAG:
| eAG (mg/dL) | Formula |
|---|---|
| 28.7 × A1C (%) − 46.7 | |
| A1C of 7.0% is approximately 154 mg/dL |
Pros and Cons of A1C Blood Test
The A1C test offers several advantages and disadvantages. Clinical guidelines recommend individualized glycemic control goals based on patient preferences and health status. Most patients aim for an A1C target between 7% and 8% to avoid unnecessary treatment burden. However, A1C levels may vary due to race, ethnicity, or other factors. Lower A1C targets do not always improve outcomes and may cause harm, especially in older adults.
| Advantages of A1C Test | Disadvantages of A1C Test |
|---|---|
| Individualized glycemic control goals can be set based on patient preferences and health status. | A1C levels can be inconsistent and influenced by race and ethnicity. |
| Recommended A1C target of 7% to 8% for most patients to avoid unnecessary treatment burden. | No evidence that A1C targets below 6.5% improve clinical outcomes. |
| Medication regimens can be de-escalated for patients with A1C levels below 6.5%. | Achieving lower A1C targets may lead to more harm than good, especially in older patients. |
Note: The A1C blood test, also known as HbA1c, remains a valuable tool, but patients should understand its limitations and discuss results with their healthcare team.
CGM, GMI and Estimated eAG
How CGM Works?
Continuous glucose monitoring technology uses a small sensor placed on the skin. The sensor measures glucose levels in the interstitial fluid, which surrounds cells. It sends data to a device or smartphone app. Users can see their glucose trends in real time. CGM helps people with type 1 diabetes and type 2 diabetes track their blood sugar throughout the day. The system alerts users when glucose levels become too high or too low. This technology supports better diabetes management by providing immediate feedback.
CGM allows individuals to monitor hypoglycemic and hyperglycemic events as they happen. This real-time information helps them make informed decisions about food, activity, and medication.
What Is GMI and CGM eAG?
The glucose management indicator, or GMI, estimates hemoglobin A1C based on CGM data. GMI does not depend on red blood cell turnover, so it can complement or replace traditional A1C tests. Clinicians first recommended GMI for use in 2017. It appears in standardized CGM reports. The goal of GMI is to express CGM-derived mean glucose in terms of A1C. GMI uses estimated average glucose from a patient’s CGM to approximate an A1C value. This method lets healthcare providers assess blood sugar control without waiting for the next lab test.
- GMI estimates A1C using CGM data.
- GMI is not affected by red blood cell turnover.
- GMI was recommended for clinical use in 2017.
- GMI expresses mean glucose as an A1C value.
- GMI uses eAG from CGM to approximate A1c.
- Providers can assess control without waiting for lab results.
Pros and Cons of CGM-Based Metrics
CGM-based metrics offer several benefits for diabetes management. They enhance understanding of glucose levels over time. These metrics improve daily management and help users recognize patterns that affect glucose control. CGM eAG provides a more accurate picture for many people with diabetes.
- CGM metrics improve daily management.
- They help users recognize patterns in glucose control.
However, CGM eAG does not capture daily fluctuations in glucose levels. It may give misleading results in certain medical conditions. Users should discuss CGM results with their healthcare team to ensure proper interpretation.
CGM-based metrics support better diabetes management, but users must understand their limitations and work with their healthcare providers for optimal results.
Comparing A1C Blood Test and CGM eAG
Accuracy and Reliability
The accuracy and reliability of the a1c blood test and cgm-based eAG measurements play a crucial role in diabetes management. Clinical studies show a high level of agreement between laboratory HbA1c and point-of-care testing (POCT-HbA1c) for both conventional blood glucose monitoring and cgm users. Researchers also find significant positive correlations between laboratory HbA1c, POCT-HbA1c, GMI, and eAG in both groups. However, small sample sizes and limited HbA1c ranges can affect the generalizability of these findings. Experts recommend standard laboratory HbA1c for initial diagnosis, while POCT-HbA1c serves as a potential method for ongoing screening and monitoring.
| Evidence Type | Findings |
|---|---|
| Agreement | High level of agreement between laboratory HbA1c and POCT-HbA1c in both BGM and CGM users |
| Correlation | Significant positive correlations between laboratory HbA1c, POCT-HbA1c, GMI, and eAG |
| Limitations | Small sample size and limited HbA1c range may affect generalizability |
| Recommendations | POCT-HbA1c is useful for screening and monitoring; standard lab HbA1c for diagnosis |
The A1C blood test provides a long-term average of blood glucose levels, while cgm-based eAG offers a more immediate reflection of daily fluctuations. Both methods support blood sugar control in people with type 1 diabetes and type 2 diabetes.
Discrepancies and Influencing Factors
Several factors can cause discrepancies between a1c and cgm eAG or GMI values. The A1C blood test measures the average glucose attached to hemoglobin over two to three months, with a stronger emphasis on recent weeks. In contrast, GMI and eAG from cgm sensors estimate mean glucose over a shorter period, usually 10 to 14 days, by sampling glucose every few minutes.
| Source of Error/Variability | Description |
|---|---|
| Analyzer Precision | Different analyzers and their sensitivity to hemoglobin variants can vary |
| Biological Variability | Natural fluctuations in A1C levels due to physiological conditions |
| Equipment Changes | Labs may change A1C analyzers, affecting consistency of A1C results |
| Testing Range | A1C tests show more variability below 6.0%, especially in prediabetes |
Health conditions also influence the accuracy of the A1C blood test. Chronic kidney disease, anemia, and metabolic acidosis can lead to falsely low or high A1C results. Severe anemia and kidney failure often decrease A1C, while liver disease can affect its accuracy.
| Health Condition | Effect on A1C Result |
|---|---|
| Chronic Kidney Disease (CKD) | May lead to lower A1C |
| Anemia | Can result in lower A1C |
| Metabolic Acidosis | Can result in higher A1C |
| Severe Anemia | Can falsely decrease A1C |
| Kidney Failure | Can falsely decrease A1C |
| Liver Disease | Can affect A1C accuracy |
Other factors that may cause discrepancies include:
- Red blood cell lifespan
- Health conditions like iron deficiency anemia and sickle cell disease
- Medications and supplements that affect a1c accuracy
When Results May Differ?
Results between the A1C blood test and cgm eAG may differ in several situations. The A1C test reflects an average over months, while cgm eAG captures glucose trends over days or weeks. This difference in time frame can lead to mismatched results, especially if a person’s blood glucose levels have changed recently.
Some common reasons for differences include:
- Iron deficiency anemia
- Sickle cell disease
- Medications such as steroids or treatments for cancer, hepatitis, and HIV
People with chronic kidney disease, anemia, or liver disease may see lower A1C values that do not match their actual blood glucose levels. In these cases, cgm-based metrics may provide a more reliable picture of glucose control. For individuals with type 1 diabetes or type 2 diabetes, understanding these discrepancies helps them and their healthcare team make better decisions about treatment and monitoring.
Tip: When A1C and cgm eAG results do not match, discuss possible causes with a healthcare provider. They can help interpret the results and adjust the diabetes management plan as needed.
Choosing the Right Method
Personal Health and Lifestyle Factors
Every person with diabetes faces unique challenges. Some individuals with type 1 diabetes or type 2 diabetes may prefer the simplicity of the A1C blood test, while others benefit from the detailed feedback provided by CGM. People who experience frequent changes in blood sugar or have conditions that affect red blood cells may find CGM eAG or GMI more reliable for diabetes management. Lifestyle also plays a role. Those who travel often or have unpredictable routines may appreciate the flexibility and real-time monitoring that CGM offers. Others may value the convenience of periodic lab visits for A1C testing.
Access, Cost and Technology
Access and affordability influence the choice between A1C and CGM. The following table compares key aspects:
| Category | A1C Tests | CGM Devices |
|---|---|---|
| Cost | Aimed to be affordable and widely accessible | More expensive due to device and sensor costs |
| Accessibility | Widely available and simple to perform | Limited availability in low-resource settings |
| Affordability | Aimed at underserved areas | High costs associated with sensors and transmitters |
CGM devices require certain technology and resources. Barriers include:
- CGM devices can be expensive, and insurance coverage is often limited.
- Reliable internet and smartphone capabilities are necessary for CGM functionality.
- Disparities exist in CGM adoption based on race and insurance status.
- Skin irritation and discomfort may lead to discontinuation.
- Some users experience data overload or psychosocial challenges related to wearing a device.
Working with Your Healthcare Team
Collaboration with healthcare professionals supports better control and understanding of both A1C and CGM eAG data. Best practices include:
| Best Practice | Description |
|---|---|
| Systematic Data Review | Review overall glycemic status, focusing on TBR, TIR, and TAR statistics. |
| Education | Provide initial and ongoing education about the CGM device to empower patients. |
| Ongoing Support | Identify procedures for continuous support for patients using CGM. |
A healthcare team can help interpret results, adjust treatment, and provide ongoing support. Many people use both A1C and CGM eAG to gain a complete picture of their diabetes. This approach helps individuals make informed decisions about their monitoring and control strategies.
Tip: Open communication with healthcare providers ensures that each person receives care tailored to their needs and preferences.
Best Practices for Diabetes Management
Combining A1C and CGM Data
Combining A1C and CGM data gives individuals a more complete view of their diabetes management. A1C testing provides a long-term average of blood glucose levels, while CGM reveals daily patterns and fluctuations. Clinical guidelines recommend using both methods to identify hidden glucose swings and adjust treatments. CGM helps detect hypoglycemic events that A1C cannot capture, which can prevent serious complications. Studies show that CGM users experience significant reductions in HbA1c levels and fewer severe hypoglycemia incidents.
| Evidence Type | Findings |
|---|---|
| A1C Limitations | A1C does not detect real-time hypoglycemic events, which can lead to serious clinical consequences. |
| CGM Benefits | CGM users experience significant reductions in HbA1c levels compared to non-users, with a reported reduction of -0.39% HbA1c. |
| Hypoglycemia Reduction | CGM adoption led to a decrease in severe hypoglycemia incidence from 14.6% to 7.8%. |
| Recommendation | Description |
|---|---|
| Individualized Glycemic Targets | Established clinical targets should be tailored based on individual health status and risk factors. |
| CGM as an Adjunct | CGM can assist in achieving A1C targets, especially in diabetes and pregnancy. |
| Comprehensive Management | Combining CGM and A1C helps identify patterns, adjust treatments, and achieve glucose control. |
Using both A1C and CGM data allows healthcare providers to tailor diabetes care for each person, including those with type 2 diabetes.
Monitoring and Adjusting Your Plan
Effective diabetes management requires ongoing monitoring and timely adjustments. CGM enables immediate decision-making based on real-time data, while A1C offers a long-term evaluation of blood sugar control. Clinical guidelines suggest checking A1C at least twice a year for stable diabetes and every three months for those needing intensive management. Regular review of CGM data, including Time in Range (TIR), helps individuals and providers make quick treatment changes.
| Testing Type | Recommended Frequency |
|---|---|
| A1C Testing | At least twice a year for stable diabetes; every 3 months for unstable or intensively managed individuals |
| CGM Data Review | Regularly review CGM data, including TIR, to make quick treatment changes |
- Following ADA CGM guidelines can enhance diabetes control.
- Time in Range is crucial for understanding daily glucose fluctuations that A1C does not capture.
Consistent monitoring and adjustment support better blood sugar control and improve outcomes for people managing diabetes.
Conclusion
Choosing between A1C blood test and CGM eAG depends on each person’s health status and lifestyle. Many individuals benefit from using both methods to gain a complete picture of diabetes management. Tracking results and understanding differences between A1C and eAG helps people with diabetes make informed decisions. Consulting a healthcare team supports personalized care and reduces risks of complications, such as retinopathy and nephropathy.
| Misconception | Explanation |
|---|---|
| A1C is always accurate | A1C can be falsely high or low due to health conditions. |
| A1C reflects daily glucose fluctuations | A1C does not show daily variability. |
| CGM is less reliable than A1C | CGM offers a comprehensive view of glucose levels. |
- Explore CGM options for real-time monitoring.
- Use an A1C tester for long-term tracking.
- Schedule regular check-ups with healthcare providers.
- Engage in physical activity, like walking after meals, to improve glucose control.
Proactive diabetes management empowers individuals with type 2 diabetes to achieve better health outcomes and live confidently.
FAQ
What Is the Main Difference Between A1C and CGM eAG?
A1C measures average blood glucose over two to three months. CGM eAG shows real-time glucose trends from continuous monitoring. Both methods help manage diabetes, but CGM provides more immediate feedback.
Who Should Consider Using CGM Instead of A1C?
People with frequent blood sugar changes, pregnancy, or conditions affecting red blood cells may benefit from CGM. CGM suits those who want detailed daily data and real-time alerts.
Can A1C And CGM eAG Results Ever Match Exactly?
Results rarely match exactly. A1C reflects long-term averages, while CGM eAG captures short-term trends. Health conditions and recent changes in glucose levels can cause differences.
Is CGM More Expensive Than A1C Testing?
CGM devices cost more due to sensors and technology. Insurance coverage varies. A1C tests are widely available and affordable.
Tip: Check insurance plans for CGM coverage before choosing.
How Often Should Someone Check Their A1C and CGM Data?
Experts recommend A1C testing twice a year for stable diabetes. CGM data should be reviewed regularly, focusing on Time in Range and patterns.
- A1C: Every 6 months
- CGM: Daily or weekly